🧬 refCNV.org Overview & Use Cases (v2)
refCNV.org provides curated CNV (Copy Number Variation) profiles derived from reference samples, including analyses from multiple pipelines (e.g., DRAGEN-CNV, PennCNV, QuantiSNP). It supports exploratory analysis, visualization, and comparison of CNV data across tools and platforms.
🚧 Note: This platform is under development and should not be used for clinical or publication purposes at this stage.
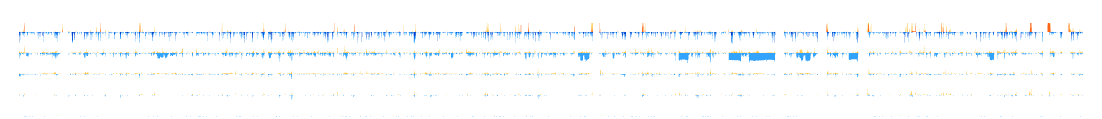
🌐 Homepage Overview
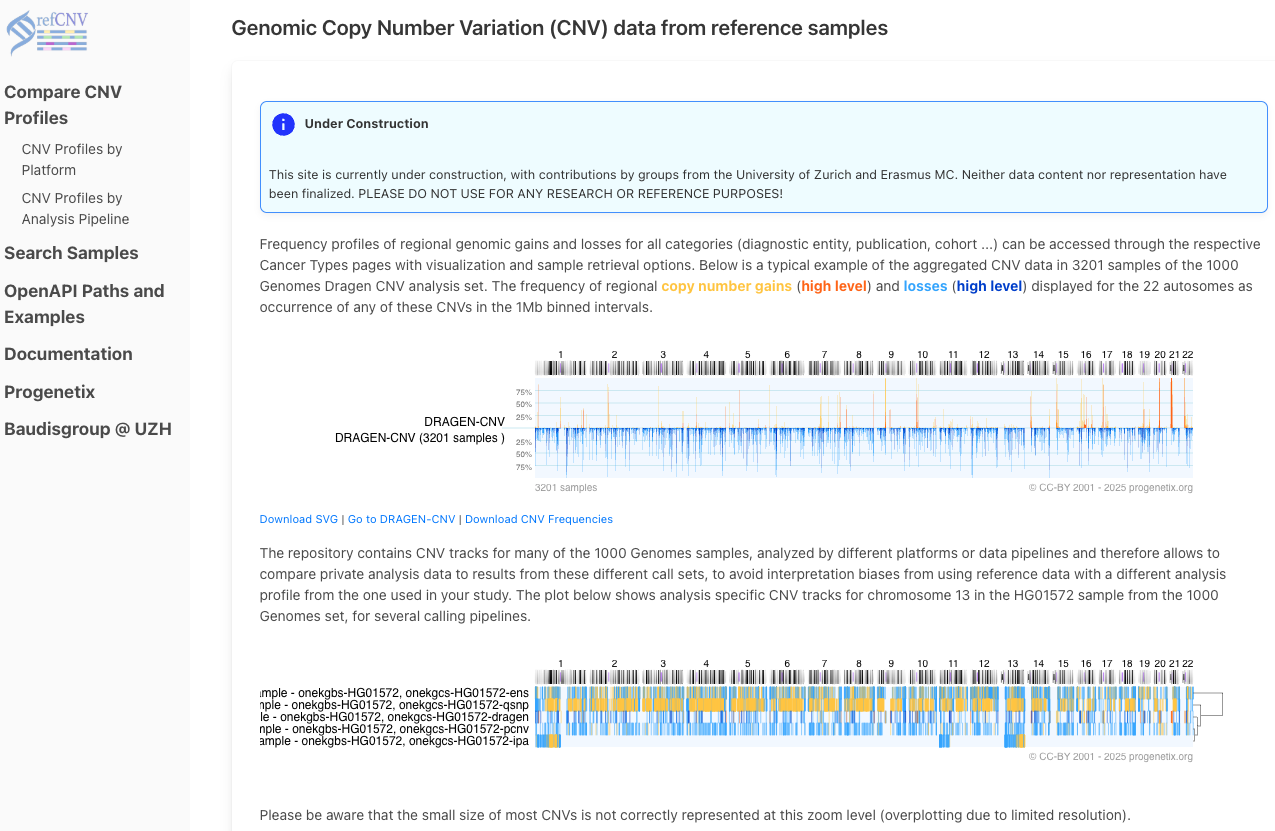
The homepage introduces the concept of regional CNV profiling using reference samples from large projects like the 1000 Genomes. It shows typical frequency plots (e.g., for DRAGEN-CNV) with summary visualizations of gains (orange) and losses (blue).
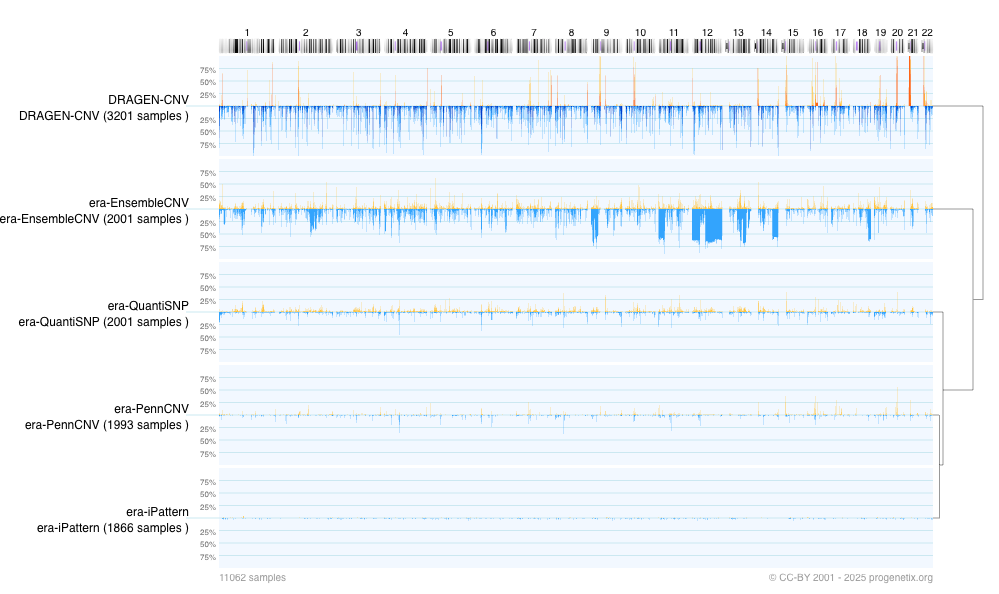
📊 Use Case 1: Compare CNV Profiles Across Pipelines
Explore how different CNV calling pipelines produce divergent results for the same sample set.
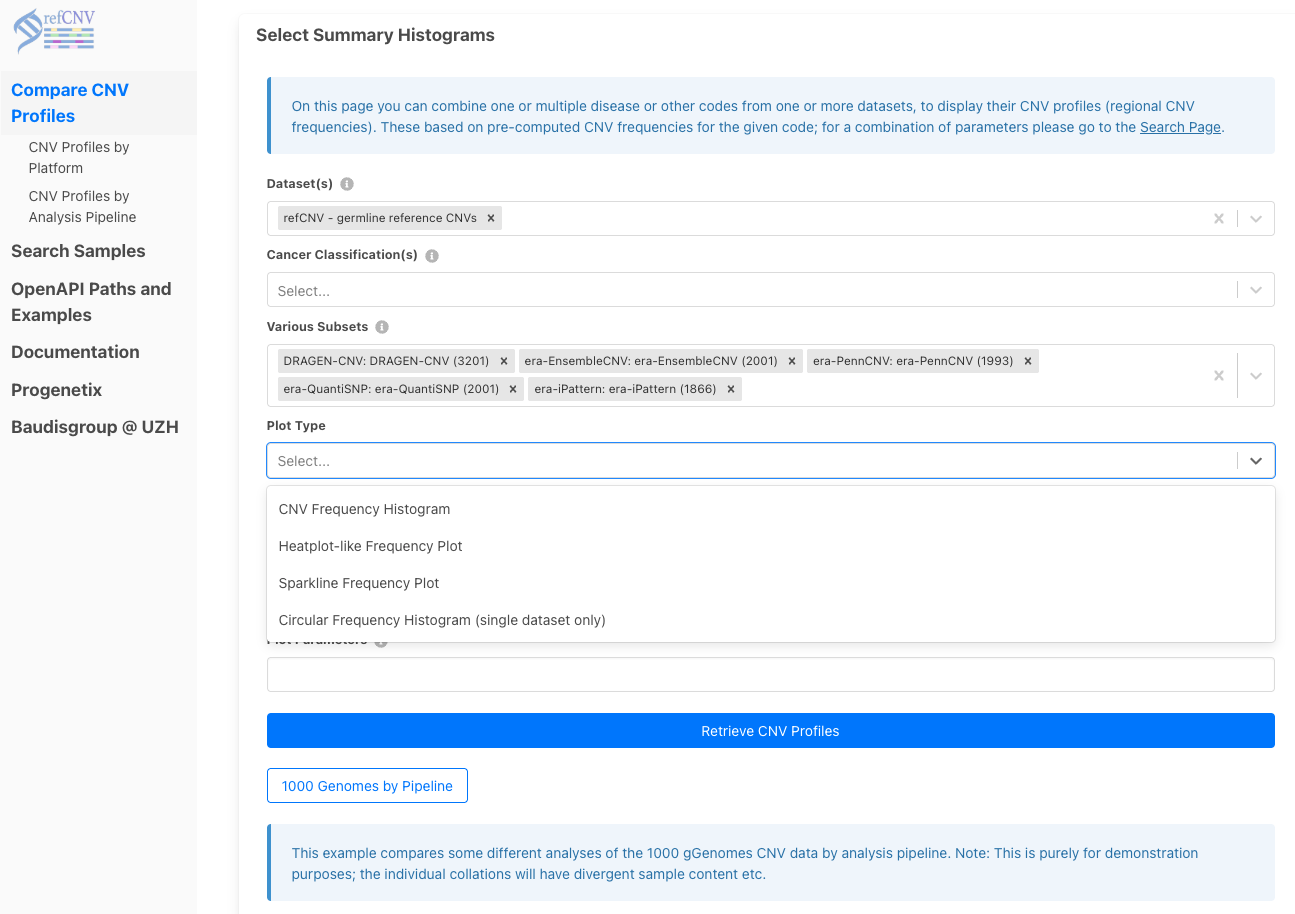
- Select
refCNV - germline reference CNVs - Choose pipelines: DRAGEN, EnsembleCNV, QuantiSNP, PennCNV, iPattern
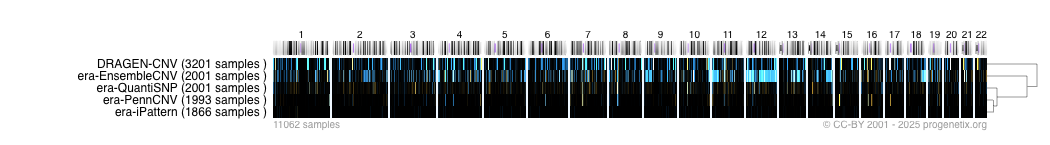
- Generate output in heatmap, histogram, or sparkline formats
📊 Use Case 2: Explore Pipeline-Specific Datasets
Use the "Analysis Pipelines" section to browse and visualize all samples processed by a specific CNV calling pipeline.
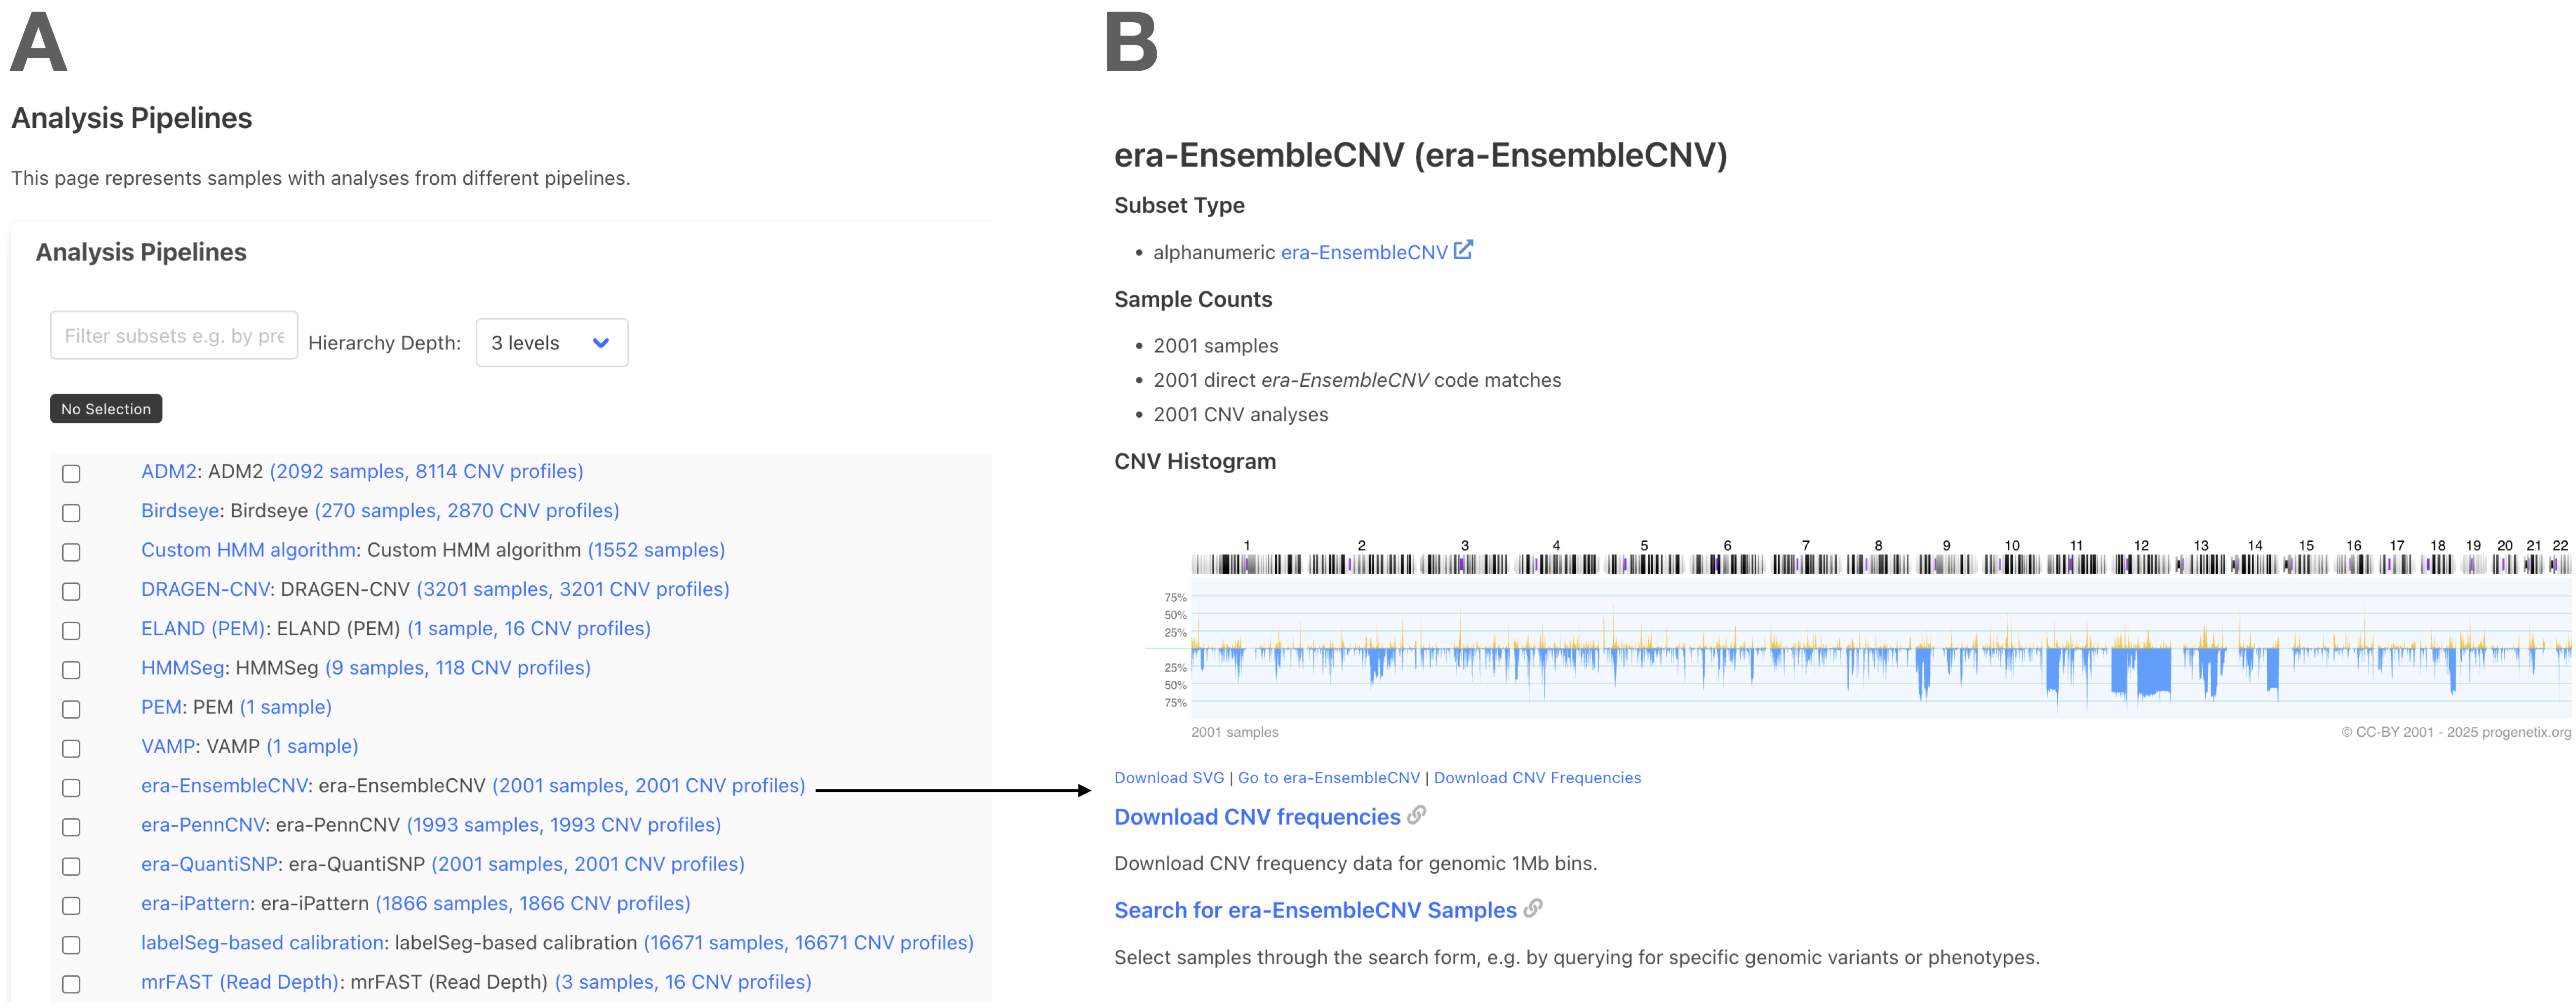
- Panel A: Select any listed pipeline (e.g., DRAGEN, EnsembleCNV)
- Panel B: View CNV histogram for that pipeline and access download links for SVG and data files
- Inspect sample counts, data origin, and direct search for specific entries
📊 Use Case 3: Platform-Based CNV Exploration
Use the “Array and Sequencing Platforms” panel to explore CNV patterns derived from specific microarray or sequencing technologies.
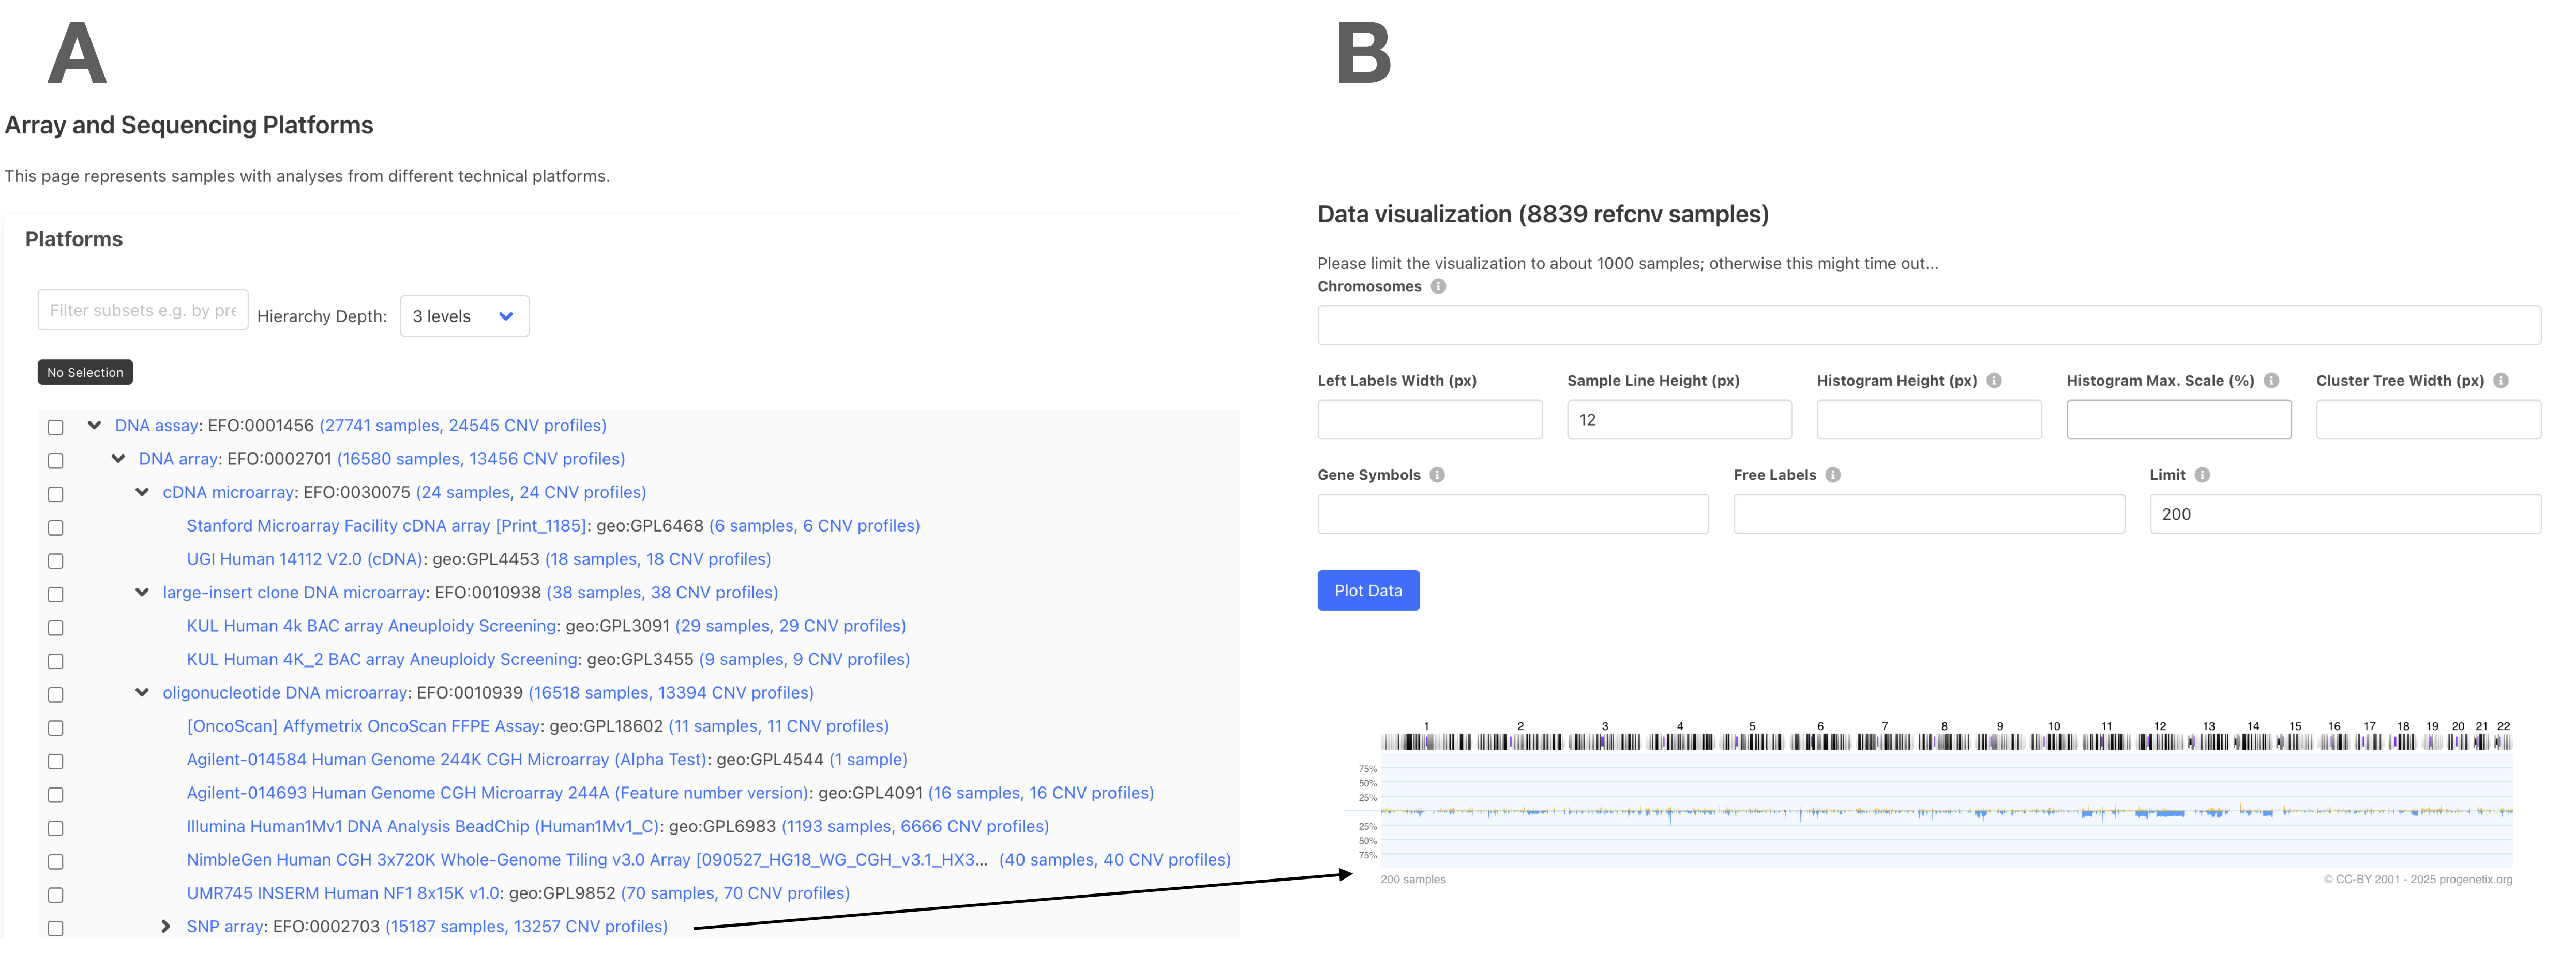
- Panel A: Choose a platform subset (e.g., Affymetrix, Illumina, BAC arrays)
- Panel B: Generate CNV frequency histograms across selected platforms
- Adjust settings like histogram height or line width before plotting
💡 Interpretation Tips
- Pipelines differ in CNV calling sensitivity and precision
- Platforms contribute inherent variability due to probe density and noise
- Use comparative plots to benchmark tools and choose references
🛠️ Additional Use Cases
-
Single Sample CNV Track Viewer
Visualize one sample across all pipelines -
Cohort CNV Signature Construction
Create merged profiles by disease or sample group -
Batch Normalization Evaluation
Compare groups to detect CNV call shifts caused by preprocessing
📚 Resources
© CC-BY 2001–2025 progenetix.org